Collecting logs: Web
This article will assist you in collecting logs from the Web SDK and Web RTC.
Contents
How to get browser console and HAR logs
When you reach out to support, we frequently request that you provide the browser console and HAR logs to assist us in investigating the issue.
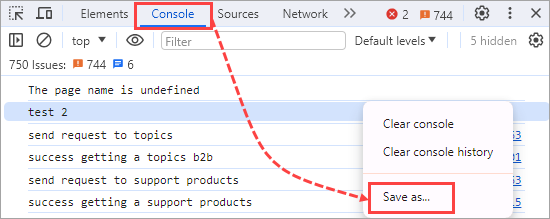
Collecting console logs
To gather the console logs:
- Open the browser developer's tools. To do that, press
F12for Chrome/Edge/Yandex browsers, or press⌘+Alt+Cfor Safari. - Right-click in the Console window and select Save as.

- Save the logs for future investigation.
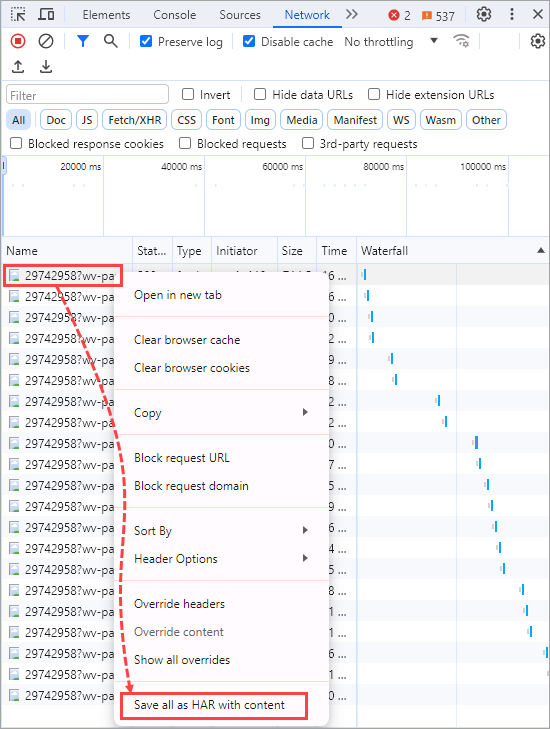
Collecting HAR logs
To gather the HAR logs:
- Open the browser developer's tools. To do that, press
F12for Chrome/Edge/Yandex browsers, or press⌘+Alt+Cfor Safari. - Select the Network tab (for all browsers).
- Clear the existing logs by clicking the ⊘ sign for Chrome/Edge/Yandex browsers, or the trash bin sign for Safari.

- In Chrome/Edge/Yandex, enable the Preserve log and Disable cache checkboxes.

In Safari, select the following icon and select Preserve logs.

- Reproduce the issue.
- In Chrome/Edge/Yandex, right-click any log and select Save as…, then choose the Export HAR (sanitized) variant.

In Safari, select Export.

- Save the logs for future investigation.
How to get mobile Safari logs
You may need to collect logs in the mobile Safari browser to debug your apps' behavior. To do this:
- On the iPhone, open Settings → Apps → Safari, scroll down to Advanced and enable Web inspector.
- On the Mac, open Safari and then press
⌘+,for Settings. Go to the Advanced tab and enable Show features for web developers. - Connect your iPhone and your Mac with a cable.
- Unlock your phone and choose Trust this device in the popup window.
- On the iPhone, open the web page that you need to collect logs for.
- On the Mac, open Safari and choose Develop from the menu bar. There you can see the list of all connected devices. Point the cursor at the necessary device to see the list of opened tabs. Choose the necessary tab.
- The web inspector window appears. Choose the Console tab.
- Click within the console window and press
⌘+Ato select all entries. - Right-click the selection and choose Save selected from the popup.
This is how you save the logs from mobile Safari. If you are using a Web SDK application, you can also enable debug logs in Web SDK, see the section below to learn how to do this.
How to get Web SDK logs
First, you have to enable logging. To do so, specify the showDebugInfo parameter while initiating an SDK instance:
Logs in Developer Console
To check the Verbose option in a Web SDK app while using it in a browser, open the developer console and select the Levels dropdown.

To view messages logged from JavaScript:
In Chrome, press F12 or
⌘+⌥+J(Mac) orCtrl+Shift+J(Windows, Linux, Chrome OS).In Firefox, select "Web Console" from the Web Developer submenu in the Firefox menu (or Tools menu if you display the menu bar or are on Mac) or press
Ctrl+Shift+K,Ctrl+Shift+CorCtrl+Shift+I(Windows) or press⌘+⌥+K(Mac).In Safari, enable the Develop menu in Advanced preferences: Safari > Preferences > Advanced > Show Develop menu, then choose Develop > Show Error Console.
Now, reproduce your issue, right-click on the console panel, and choose "Save as…" to save the output to a file.
Do not forget to send the result file to our Support team if needed.
Logs in Browser
To view logs in the browser’s main window, use either Chrome or Firefox. Open “chrome://webrtc-internals/“ or “about:webrtc” URL accordingly.
Next, open the Web application being debugged in a new tab and reproduce the problem.
Finally, go back to the logs tab and save them as Web Page, Complete.
Log Collector
For those who want to organize logs in a special way (e.g., collect them in a database for further analysis), we've got a demo called log-collector, that is available freely on GitHub.
The demo allows you to collect logs about call state and send them to your backend server. What backend server to choose is up to you; the demo works fine with all of them since it sends POST requests and uses no black magic.
How to get WebRTC logs
WebRTC logs are invaluable resources for developers and Voximplant technical support in troubleshooting audio and video connection issues. Currently, only Chrome and Firefox web browsers can generate these logs. This article offers a comprehensive guide on how to download them.
Chrome web browser
- The browser tracks and logs all WebRTC connections, so close all tabs and restart the browser.
- Open a new tab and point it to the "chrome://webrtc-internals/" URL.
- Open the Web application being debugged and reproduce the problem.
- Go back to the "chrome://webrtc-internals/" tab, there will be at least two tabs:
- GetUserMedia Requests and https://your/application/url. You will see logs along with stats graphs.
- Choose the tab with the name of your application and save the page content as Web Page, Complete.
Stats graphs are not available in the saved file! We recommend either analyzing graphs while being on the chrome://webrtc-internals/ tab, or making screenshots for further usage.
Firefox web browser
- Close all tabs, open a new one, and point it to the "about:webrtc" URL.
- Open the Web application being debugged in the new tab and reproduce the problem.
- Go back to the "about:webrtc" tab and save the page content as Web Page, Complete.
How to debug remote clients
Learn how to collect logs about the state of calls and send them to your backend server using the Voximplant logs collector.
Here is how you can make the module serve your needs:
- Clone this repo.
- Go to the Applications section of the Voximplant control panel and click on your application.
- Switch to the Scenarios tab and create a new scenario. Paste the code from the
Scenarios.VoxEngine.js filehere, then save your scenario. - Go to the repo folder, open
logger.js, and paste your backend server hostname in line 43. Save the file. - Open
index.htmlin any browser. - Fill in the username and password fields, e.g.:
username:
username@appname.account.voximplant.compassword:12345 - Start an outgoing call or answer the incoming one.
- When you need to send your logs, push the Report button.
